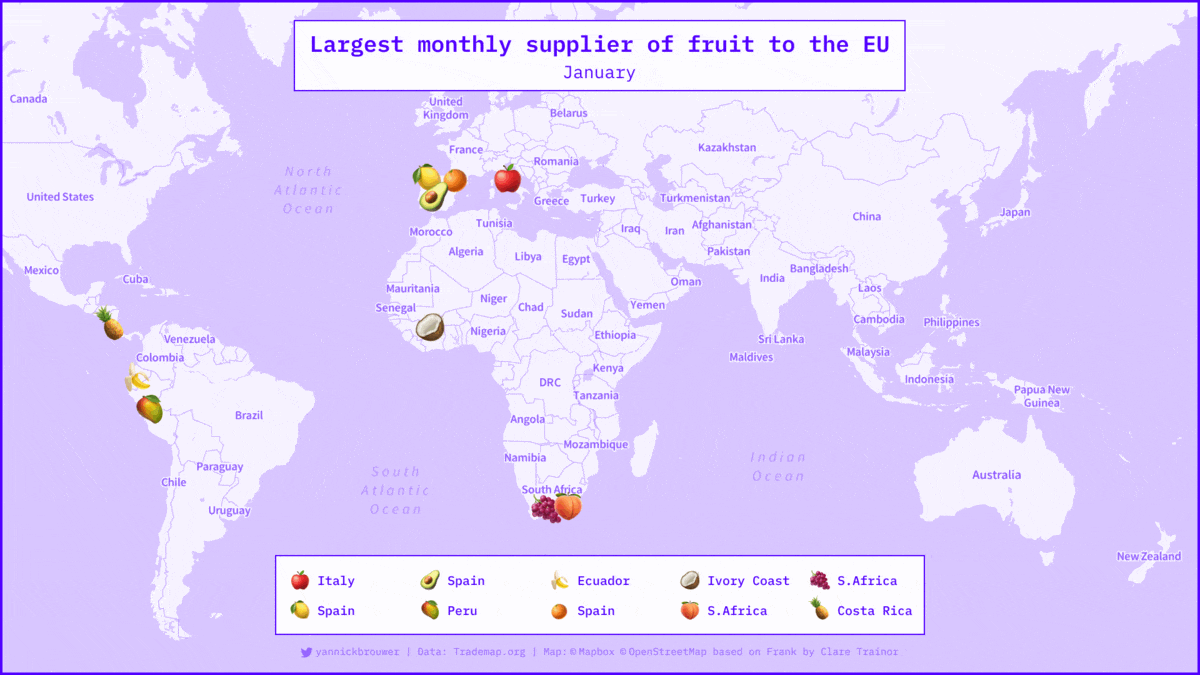
 [OC] Where Europe's fruit grows🍋
Submitted by mapsbyy t3_yog5ys in dataisbeautiful
mapsbyy OP t1_ive2n7t wrote
For the visualization I wanted to get a bit experimental, it's definitely not the most digestible map but I like how you can follow the individual emoji’s to explore patterns.
Data is from trademap.org and the design is done in Figma.
You can find more data visualizations on my Twitter
Viewing a single comment thread. View all comments