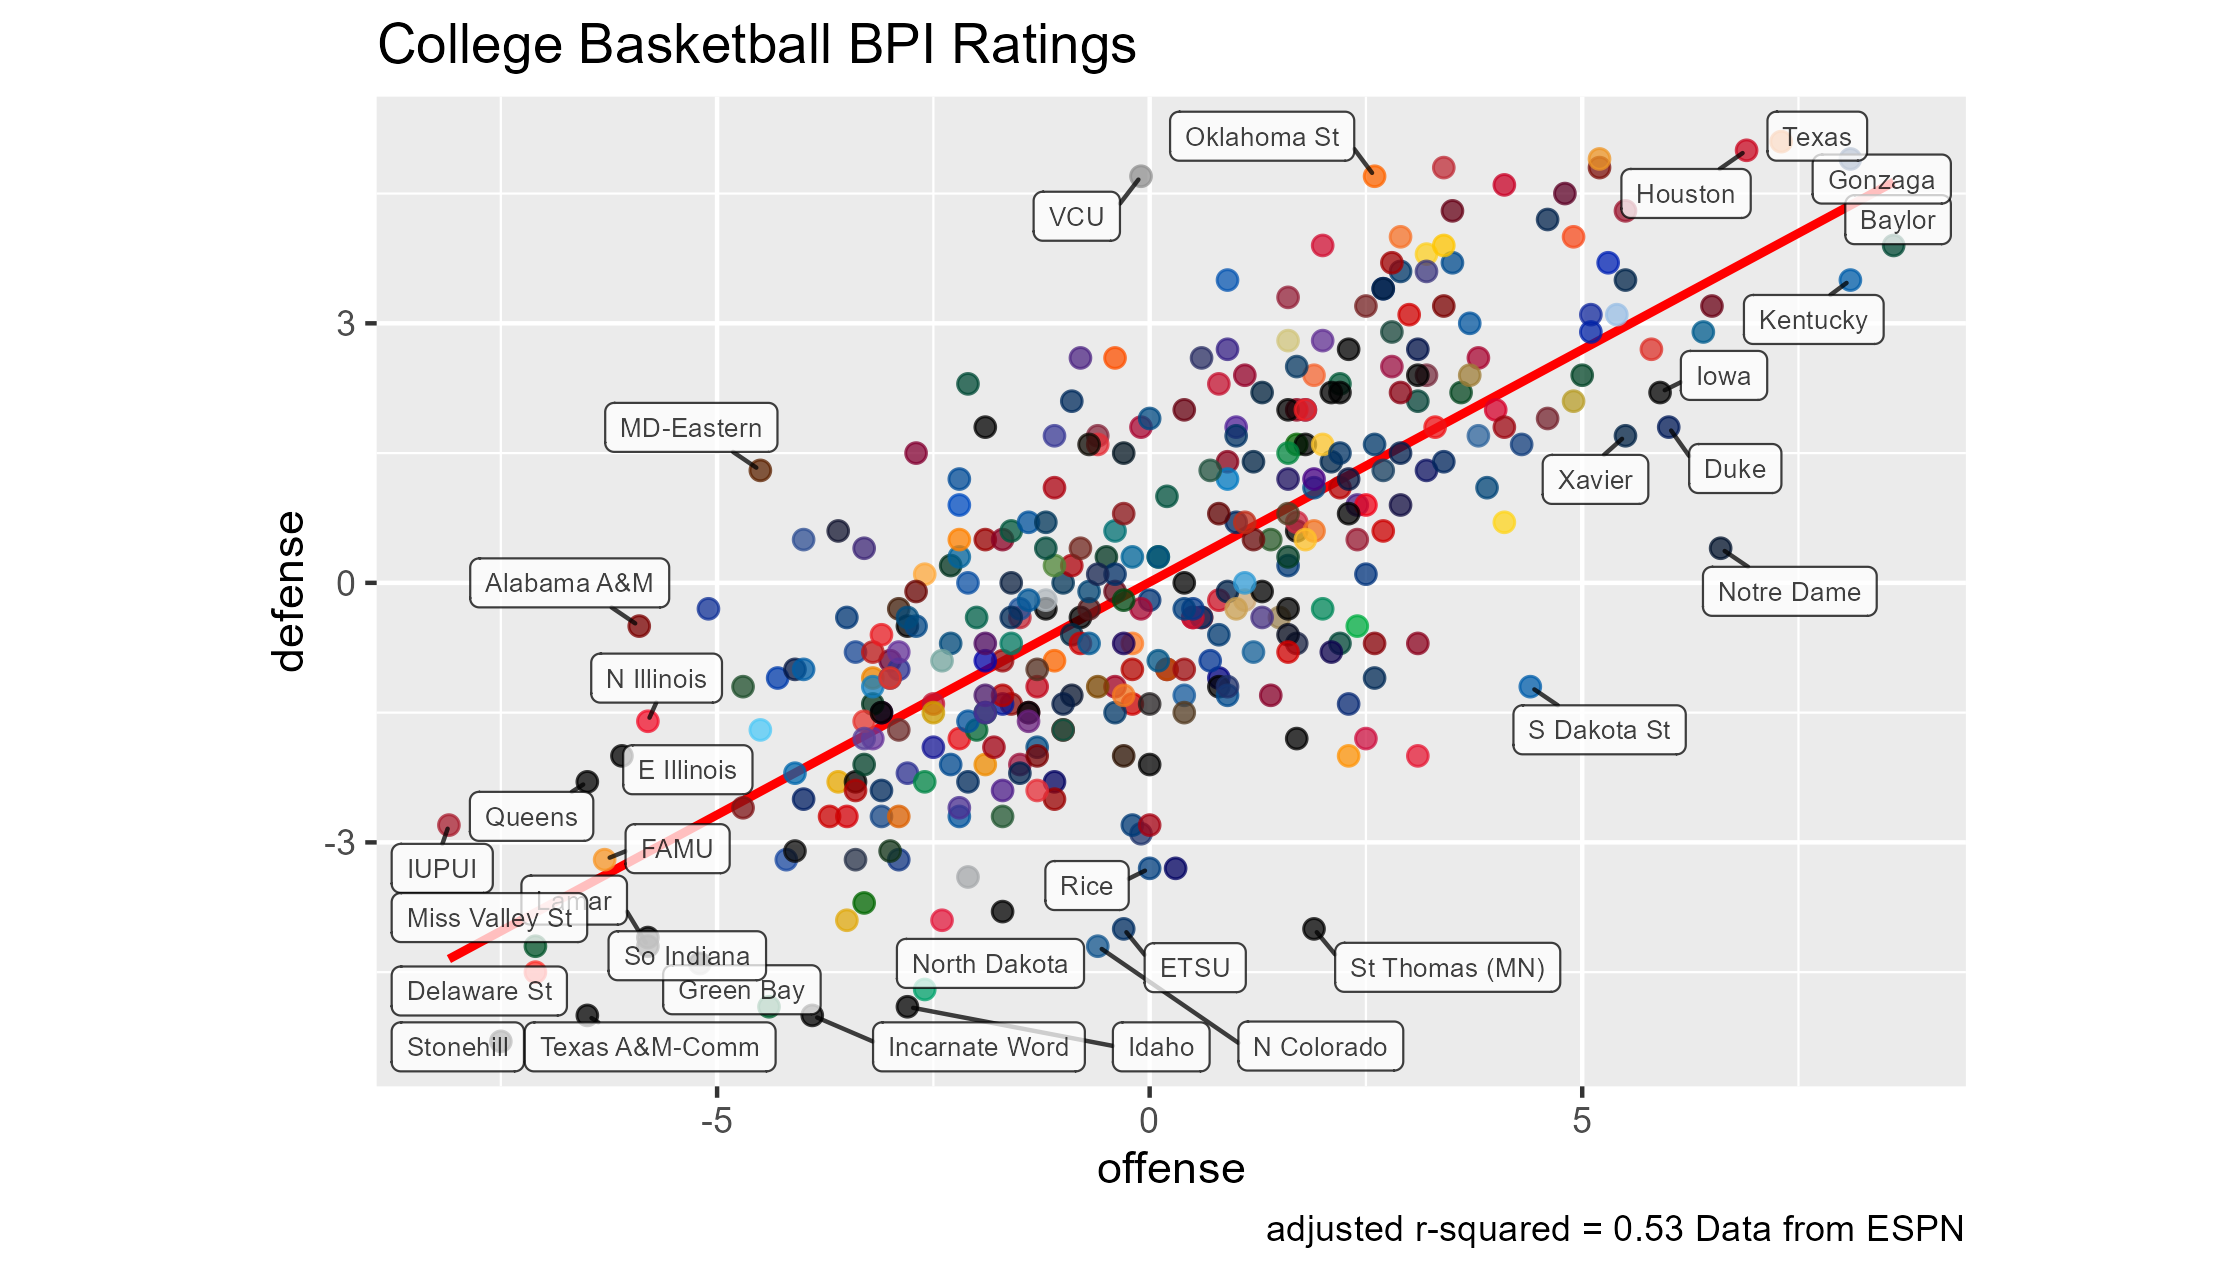
 [OC] College Basketball BPI Rankings for all 363 teams. Check out the strong correlation between offense and defense. Link to interactive version in comment.
Bischrob OP t1_iwdz52u wrote
Interactive version: https://bischrob.github.io/RScripts/public/CBB-BPI-widget.html
Made in R using ggplot and plotly (for the interactive version) with data from ESPN.com
BPI explanation: "The Men's College Basketball Power Index (BPI) is a measure of team strength that is meant to be the best predictor of performance going forward. BPI represents how many points above or below average a team is."
Viewing a single comment thread. View all comments