Recent comments in /f/dataisbeautiful
Golden_Mandala t1_izk4yr5 wrote
Reply to comment by EaterOfFromage in [OC] How to spot misleading charts? I would like to hear your opinion on the subject, also any tips design-wise? by dark_o3
Wow! Makes wonder how accurate the speedometer is.
jcstan05 t1_izk4osh wrote
Fascinating, but I feel like a more useful metric would be Number of Medical Schools per capita or per square kilometer. Brazil is pretty big both geographically and by population.
BlitzOrion OP t1_izk4nq6 wrote
Source: WDOMS
Tool used: Excel
[deleted] t1_izk3tnt wrote
Reply to comment by giteam in [OC] Largest mergers & acquisitions, inflation adjusted by giteam
[deleted]
Common-Tangerine754 t1_izk2rur wrote
Reply to [OC] How to spot misleading charts? I would like to hear your opinion on the subject, also any tips design-wise? by dark_o3
This is great. I see a lot of these misleading charts (surprise surprise) when people discuss political issues. Additionally a lack of variables.
Great depiction. Sharing with fellow nerds.
EaterOfFromage t1_izk2pl0 wrote
Reply to comment by Golden_Mandala in [OC] How to spot misleading charts? I would like to hear your opinion on the subject, also any tips design-wise? by dark_o3
I rented a car the other day where the speedometer did this. Equal spacing of 0, 5, 10, 15, 20, 25, 30, 40, 50, 60... Just suddenly switched from 5 to 10 kmph increments with no visual indicator.confused the hell out of me.
notyogrannysgrandkid t1_izk2dss wrote
Telecom companies are seriously dirty sluts
kyoorius t1_izk1xar wrote
Reply to [Topic][Open] Open Discussion Thread — Anybody can post a general visualization question or start a fresh discussion! by AutoModerator
Anyone have an idea how to make a straight line representation of a river as a "ruler" attached to other polygon data, eg, surrounding census boundaries?
Like this ruler in the LA River Master Plan.
I know some GIS and can't figure it out, but I'm guessing this was done using D3 or something?
Time_Crystals OP t1_izk1jey wrote
Reply to comment by -o__________o- in Percent (x100) Change in Renewable Energy Usage by US State from 1990 to 2020 [OC] by Time_Crystals
Actually that would be +1000%! The numbers are crazy.
Time_Crystals OP t1_izk1f51 wrote
Reply to comment by AssymmetricalEagle in Percent (x100) Change in Renewable Energy Usage by US State from 1990 to 2020 [OC] by Time_Crystals
Nope, it actually has 104% more. If you look closely, there is a slight green tint to it.
Elocai t1_izjzzcj wrote
Reply to comment by Korwinga in [OC] How to spot misleading charts? I would like to hear your opinion on the subject, also any tips design-wise? by dark_o3
The moment you compare those temperature, either in graph or in percent, you need to switch to K first.
10°C is not half as cold as 20°C
mick4state t1_izjz9hm wrote
Reply to comment by spiral8888 in [OC] How to spot misleading charts? I would like to hear your opinion on the subject, also any tips design-wise? by dark_o3
I think there are good reasons to cut a y axis short, but you have to know your audience. If there are small differences, but you want to draw attention to those differences, it can make sense. I've done it in academic papers before, comparing scores in one group around 80% and scores in the other group around 87%. Statistically significant, but the full-scaled graph just doesn't present that information clearly. Scientists can handle looking at the y axis to check, but your everyday person likely won't.
Bugfrag t1_izjz4fh wrote
Reply to [OC] How to spot misleading charts? I would like to hear your opinion on the subject, also any tips design-wise? by dark_o3
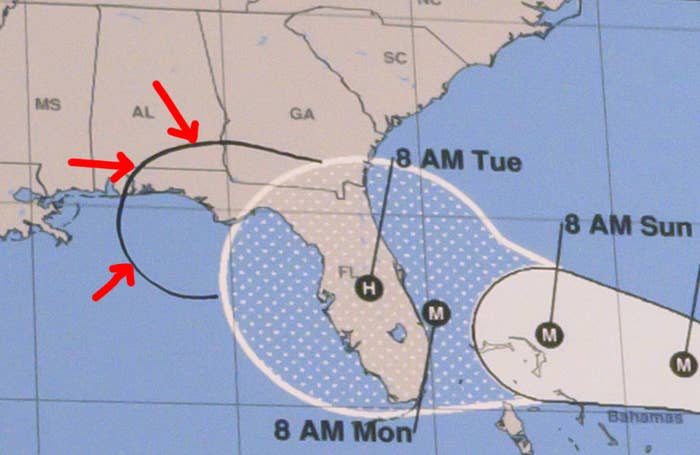
What's your opinion on hand-drawn charts?
RedOblivionLW t1_izjyr3z wrote
Reply to comment by NovaticFlame in [OC] Largest mergers & acquisitions, inflation adjusted by giteam
Ye I just watched a video on it and it's insane that time warner just agreed to it.
And you where right AOL bought them
amitym t1_izjxqie wrote
Reply to comment by Penkala89 in [OC] How to spot misleading charts? I would like to hear your opinion on the subject, also any tips design-wise? by dark_o3
"Never attribute to typos what can be adequately explained by an indifference to the shift key."
Relyst t1_izjwb2e wrote
Reply to [OC] How to spot misleading charts? I would like to hear your opinion on the subject, also any tips design-wise? by dark_o3
Another one that chaps my ass is representing 1-dimensional data with 2-dimensional areas. Almost always misrepresents the data.
lnieder t1_izjw81g wrote
Reply to [OC] Birth months of FIFA World Cup players. The top three are January, February and March, possibly due to the "Relative age effect" by desfirsit
This is nothing new if you've read Malcolm Gladwell's book Outliers.
SmilgaNir OP t1_izjv4ba wrote
LoathsomeNeanderthal t1_izjtvp8 wrote
Reply to [OC] How to spot misleading charts? I would like to hear your opinion on the subject, also any tips design-wise? by dark_o3
How to lie with statistics by Darell Huff. It was originally published in 1954 but it still as relevant of ever, highly recommend. The book discusses some of the most common misleading statistics.
JamminOnTheOne t1_izjtkv3 wrote
Reply to comment by mnemloch in [OC] Largest mergers & acquisitions, inflation adjusted by giteam
Look more closely. United Tech and Raytheon is on there, but at a higher inflation-adjusted number.
Uumm_wat t1_izjs9li wrote
Reply to [OC] How to spot misleading charts? I would like to hear your opinion on the subject, also any tips design-wise? by dark_o3
If the republicans didn’t have misleading charts, they have no charts.
oldmanshep t1_izjriv9 wrote
Reply to [OC] How to spot misleading charts? I would like to hear your opinion on the subject, also any tips design-wise? by dark_o3
Stuff like this is why I think an intro data science/intro stats course should be mandatory in high school.
passed_turing_test t1_izjq1j3 wrote
AOL and Time Warner. This will be taught in bad decisions in business schools for a long time. Proof that CEO's "vision" is limited.
cuteman t1_izjpatn wrote
Reply to [OC] How to spot misleading charts? I would like to hear your opinion on the subject, also any tips design-wise? by dark_o3
Aka "how to lie with statistics"
Good book. I suggest everyone read it.
vezkor09 t1_izk54ju wrote
Reply to [OC] Largest mergers & acquisitions, inflation adjusted by giteam
if Verizon buying 45% of Vodaphone makes the list then Berkshire Hathaway buying 5.8% of apple should make the list. Current market value of 132 Billion...